


The ordinate indicates workshop ratings(0.0~200.0).
The abscissa indicates World Finals rankings(Only show top 24).
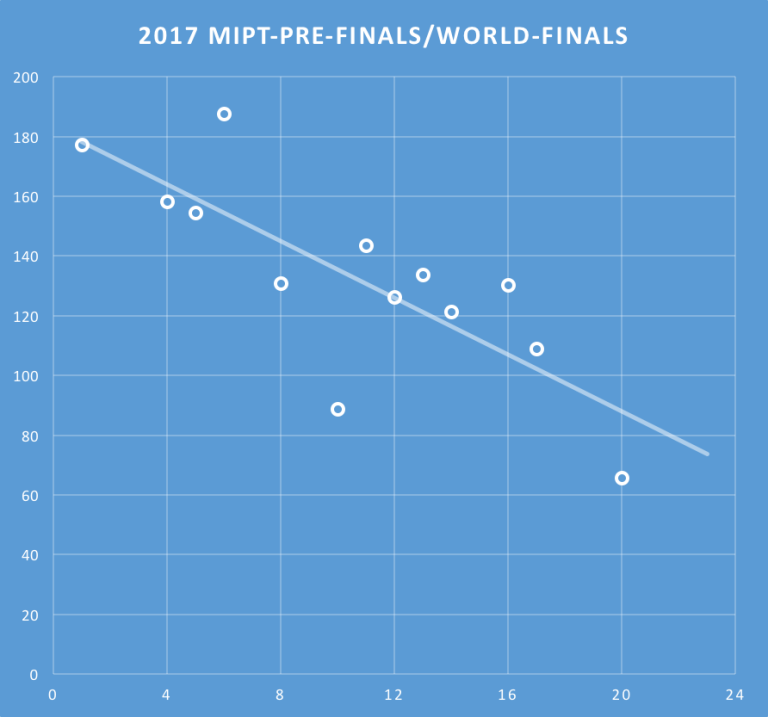

Why do they look so different?
| # | User | Rating |
|---|---|---|
| 1 | tourist | 3757 |
| 2 | jiangly | 3647 |
| 3 | Benq | 3581 |
| 4 | orzdevinwang | 3570 |
| 5 | Geothermal | 3569 |
| 5 | cnnfls_csy | 3569 |
| 7 | Radewoosh | 3509 |
| 8 | ecnerwala | 3486 |
| 9 | jqdai0815 | 3474 |
| 10 | gyh20 | 3447 |
| # | User | Contrib. |
|---|---|---|
| 1 | maomao90 | 171 |
| 2 | awoo | 165 |
| 3 | adamant | 163 |
| 4 | TheScrasse | 159 |
| 5 | maroonrk | 155 |
| 6 | nor | 154 |
| 7 | -is-this-fft- | 152 |
| 8 | Petr | 147 |
| 9 | orz | 146 |
| 10 | pajenegod | 145 |
The ordinate indicates workshop ratings(0.0~200.0).
The abscissa indicates World Finals rankings(Only show top 24).
Why do they look so different?


Can you label the axes? I don't understand the graphs at all.
Thanks for your reminding.
Auto comment: topic has been updated by tun (previous revision, new revision, compare).
Auto comment: topic has been updated by tun (previous revision, new revision, compare).
Hello, it seems your graph has missed my team :'(
My team is UET-VNU and we participated in Moscow Workshop under the name "Vietnam NU". We were ranked 15th in the Finals and had a rating of 86.22 in the Workshop.
Nice graph anyway :)
Thanks, it has been corrected.
Maybe it also worth analyzing the relationship between OpenCup results and world final results. And possibly GP-X scores or ranks suits better than ratings.
Not sure if your question "Why do they look so different?" is rhetorical, but the reason is because both samples are too small to conclude anything with high confidence.
Auto comment: topic has been updated by tun (previous revision, new revision, compare).
Trash problemset from this year's WF.